
Section 351 ETF

The ETF Hunger Games: The Brutal Math Behind the Launch Explosion

ETF Launches vs. Closures (2019–2025)

ETF launches are skyrocketing, but the math is brutal: 90% of new active funds operate at a loss while legacy giants take all the cash.

Smaller ETF fund sponsors already know the market is incredibly tough, but recent data reveals a stark reality: product manufacturing has completely decoupled from organic asset gathering. We are currently witnessing a classic “spaghetti on the wall” phenomenon where issuers throw hundreds of niche, active, and derivative-based strategies at the market to see what sticks.

ETF Launches vs. Closures (2019–2025)

The underlying numbers paint a brutal story. In 2025, issuers rolled out a record-shattering 1,167 new ETFs. Yet, the ratio of annual industry inflows to new product launches has plummeted by over 30% from its post-pandemic peak, dropping from $1.88 billion per launch in 2021 down to just $1.28 billion by 2025.

Where is the money actually going? It is being siphoned directly to the top. A tiny elite of legacy index-tracking giants continues to suck up the lion’s share of investor capital. For instance, Vanguard’s VOO alone swallowed over $113 billion in a single year—capturing more investor cash than hundreds of new active launches combined.
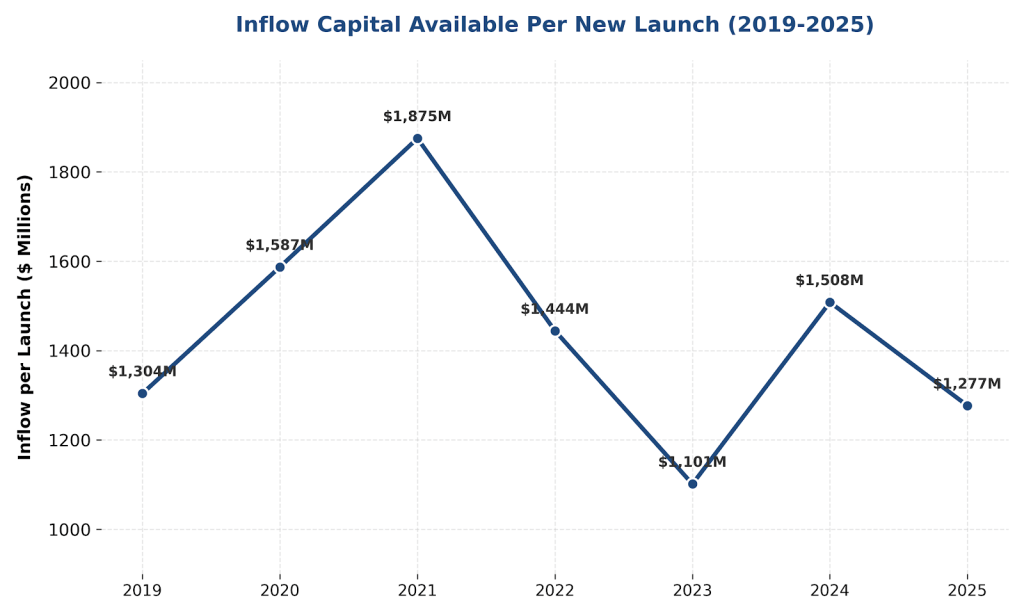
Inflow Capital Available Per New Launch

This top-heavy dynamic creates a lethal environment for independent sponsors. While the aggregate average AUM per ETF looks healthy on paper (inflated by mega-caps and a roaring equity bull market), the median fund is starving. Today, nearly 90% of new active ETF launches fail to cross the crucial $50M to $100M operational breakeven threshold within their first year. This means the vast majority are running at a pure loss.

With liquidations climbing back up to 232 per year, the runway for new funds is shorter than ever. For boutique sponsors, survival requires moving away from copycat strategies and focusing on hyper-distribution; otherwise, you’re just adding to the noise on a very crowded wall.

The $5.0 Trillion Seeding Pipeline Hiding in Taxable Accounts

$5.0 Trillion Seeding Pipeline Hiding in Taxable Accounts

Every ETF issuer knows the Day-1 problem. A new fund needs scale to earn shelf space, satisfy exchange listing economics, and attract the institutional flows that follow AUM. The traditional answer is seed capital and years of slow organic inflows. New research from ExchangiFi points to an alternative pipeline, and it is measured in trillions.

The paper estimates $5.0 trillion in U.S. taxable equity assets are structurally suited to Section 351 tax-deferred conversion into ETF wrappers. These are not flows competing on expense ratio. They are assets locked in place by embedded gains, held by investors whose alternative to converting is to do nothing. The top 10% of households hold roughly 87% of the $57.7 trillion in household equity wealth, much of it at realization hurdles above 35% in high-tax states.

For a fund sponsor, the strategic logic runs in both directions. The conversion solves a pressing problem for the contributing investor. It also delivers a large block of assets into the fund in a single tax-efficient transaction. A launch seeded through Section 351 contributions can open with the AUM and liquidity profile that would otherwise take years to build. Polen Capital, Cambria, and Alpha Architect have already run versions of this playbook.

The sizing model matters for product design. The $2.9 trillion in concentrated single-stock positions requires pooled, pre-diversified vehicles, since the 25% and 50% diversification tests cannot be cleared by a single contributor alone. The $1.0 trillion in aged direct-indexing accounts arrives already diversified and maps naturally into broad-market or factor products. The $1.1 trillion in active SMAs suits active ETF conversions, where the in-kind redemption mechanism permanently eliminates the turnover tax drag the SMA structure imposed.

The binding constraint is not demand or manager appetite. It is operational capacity. Compliant basket construction, diversification testing at the moment of contribution, contributor coordination, and clean in-kind execution. ExchangiFi operates the marketplace and automation layer that connects issuers to contributing wealth managers and runs that machinery at scale.

Connect with ExchangiFi to scale your next fund launch.

ETFs Cross the Threshold From Wrapper to Backbone

conversions, 351 exchanges, share classes

State Street’s 2026 Global ETF Outlook makes the case that ETFs have outgrown their original identity. With global ETF assets approaching $22 trillion, the vehicle once described as a disruptive wrapper now functions as core market infrastructure.

Three global trends shaping the year ahead for ETFs.

First, active ETFs continue to pull capital across regions. Active fixed income and derivative income strategies like covered calls and defined outcome funds are driving most of the flow. The fixed income shift is striking. In 2022, active strategies captured 6 percent of total fixed income ETF inflows. By 2025, that figure reached 42 percent.

Second, the wrapper is absorbing strategies that used to live behind institutional walls. Multi coin crypto, pre IPO exposure, and private market style ETFs are pushing into the liquid open ended format. These strategies carry capacity constraints. Issuers will need to manage liquidity, scaling, and investor education as the lines between public and private exposure continue to blur.

Third, growth will hinge on operational plumbing more than ticker launches. Three structural shifts stand out.

Mutual fund to ETF conversions crossed 170 funds and over $125 billion in assets, with more than 50 conversions in 2025 alone. Half of surveyed issuers plan to convert at least one fund over the next twelve months.

Section 351 exchanges are gaining traction as wealth managers look for ways to contribute appreciated securities into diversified ETFs without triggering capital gains. The mechanism functions as an efficient external seeding channel and a tax aware path for advisors managing concentrated client positions.

State Street's 2026 ETF outlook. Active flows, mutual fund conversions, and Section 351 exchanges are reshaping the $22 trillion market

ETF share classes within existing mutual fund structures are expected to launch in early 2026 following regulatory relief. The rollout may be slow given operational complexity and differing economics across gatekeepers, but the structure preserves historical track records and opens a long runway for legacy managers.

The regional picture varies. North America entered 2026 on back to back years of $1 trillion plus US inflows and a record $100 billion in Canada. ETFs now represent roughly 30 percent of Millennial portfolios. Europe is on pace to top $4 trillion in AUM by year end, driven by retail distribution and retirement platforms. Asia Pacific growth is uneven, shaped by local tax programs, leverage rules, and policy backed thematic demand.

The conclusion is direct. Success in 2026 will depend on execution over expansion. The firms that win will be those that can operate at scale, manage the backend complexity of dual structures, and stay structurally resilient through volatility.

Source: State Street, 2026 Global ETF Outlook: From Wrapper to Backbone